Beyond Tray Counts: Building a Smarter, Measurable Future for Sterile Processing

For years, sterile processing professionals have been asked to do more with less. They are expected to improve turnaround times, support surgical growth, manage complex instrumentation, and prevent infection — all while operating with limited visibility into what “good” performance really looks like.
Unlike surgical services or infection prevention, sterile processing departments (SPD) lack standardized metrics and benchmarking. There are no widely accepted national indicators for quality, productivity, or cost.
As a result, SPD leaders are often flying blind, struggling to make a data-backed case for staffing, resources, and technology.
“Healthcare is highly data-driven in patient care, but decisions in SPD are often made without data,” said Ajay K. Jain, MBA, managing partner, SteriPro International. “Most hospitals have no idea what they spend on reprocessing, even though it may represent 2–4% of their total annual budget. Decisions are being made without knowing how many instruments exist, how long it takes to reprocess an instrument, or where the real bottlenecks are.”
The data gap: A persistent barrier to progress
Productivity without context
When sterile processing leaders discuss productivity, the metrics vary widely. One common metric used is “number of trays processed,” which does not capture the complexity or variability of sterile processing work.
“We’re trying to measure productivity in a way that doesn’t reflect what our teams actually do,” said Carol Malone, AAB, CSPDT, CRCST, CIS, CHL, CER, sterile processing educator, The Cleveland Clinic. “One tray might have four instruments; another might have 600. You can’t compare those side by side and say that’s the same workload.”
In many hospitals, productivity metrics still trace back to operating room (OR) volume or case counts, which is data that ignores an SPD team’s full scope of work. Beyond reprocessing instrumentation for in-house surgical and other procedural services, it is common for sterile processing professionals to take on cart and tray transport, crash cart refills, instrument reprocessing for clinics, loaner tray reprocessing, and other myriad responsibilities.
“Even within the same health system, facilities track productivity differently,” Malone explained. “Without standardized data, it’s nearly impossible to advocate for staff or resources.”
Quality without benchmarks
Data challenges also extend to quality measurement. Edna Gilliam, DNP, MBA, RN, CNOR, NEA-BC, assistant vice president, Perioperative Services & SPD, DV, Nemours Children’s Hospital, contrasted sterile processing with infection prevention — where data such as surgical site infections (SSI) and central line-associated bloodstream infections (CLABSI) rates enable meaningful improvement and accountability — noting how SPD teams lack a comparable set of indicators for quality and productivity.
“In infection prevention, we have clear data on infection rates, but there’s nothing equivalent for sterile processing—no national benchmarks we can use to compare performance or advocate for resources,” Gilliam explained. “The sterile processing community needs consensus on meaningful data points—something that allows leaders to benchmark performance and advocate for staffing, training, and investment.”

Gilliam emphasized that quality reporting is often self-reported and inconsistently captured in tracking systems. “We’re relying on honesty and available time, which means some sites that report more issues may look worse on paper than those that don’t report at all,” she explained. “We need standardized definitions, automated reporting, and real transparency.”
She noted that another major data gap lies in defining acceptable levels of bioburden, stating: “Expecting zero percent bioburden isn’t realistic. Human factors will always play a role, but we need evidence-based guidance on what’s acceptable and achievable in the real world. Without consistent definitions or reporting, it’s hard to know how you’re performing compared to peers.”
Cost without clarity
The inability to calculate reprocessing costs remains one of SPD’s most persistent blind spots. Jain explained how metrics that track economic and efficiency-based KPIs, including instruments processed per hour per technician, cost-per-instrument, and first-pass yield rates, link SPD operations to measurable business value.
“Without visibility into what reprocessing actually costs, you’ll never have reliable cost-per-case data, and that means you’re making financial decisions in the dark,” said Jain. “Once leaders calculate their cost-per-instrument — including labor, consumables, repairs, utilities, and equipment depreciation—they begin to see how SPD efficiency directly affects the bottom line. If you can tell your CFO what it costs to reprocess a single instrument, you’ll have their attention. That’s how SPD earns a voice in financial and operational planning.”
“Process mapping in SPD is simply documenting the work as it happens — from point-of-use in the OR through transport, decontamination, inspection and assembly, packaging, sterilization, storage, and back to the OR,” Jain explained. “We timestamp each handoff, count the work units (trays, instruments, and cases), and record defects at the exact step they occur. That gives us a baseline for how the department truly performs day-to-day — how long each step takes, where labor load peaks, where backlogs form, and how work moves across people and equipment.”
Operations without insight
Instrument tracking systems can provide rich operational data, but many are underutilized or inconsistently configured.

“Everybody’s all over the place,” said Malone. “Facilities collect scan points differently, which makes data inconsistent. So, how do we first get everybody on the same page as far as collecting the data of scan points. And then how do we turn that into productivity?”
That lack of standardization makes it difficult to track tray turnaround times and technician throughput or process bottlenecks, which are key data points that could drive smarter staffing and flow optimization.
When asked how sterile processing departments can better leverage instrument tracking systems to track tray turnaround times, measure technician throughput, and identify process bottlenecks, Seamus Johnson, senior director of product development, Censis Technologies, stated:

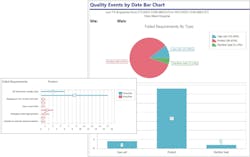
“Modern instrument tracking systems give sterile processing departments real-time visibility into tray turnaround and staff productivity. By scanning trays at each step, the system logs timestamps, locations, and user activity, enabling managers to monitor processing times, identify delays, and balance workloads. Productivity reports highlight bottlenecks — such as trays waiting for a sterilizer or assembly bench — so leaders can target improvements.”
Why it matters: Data as a bridge between SPD and the C-suite
Few departments sit at the intersection of patient safety, operational efficiency, and cost the way sterile processing does. Yet without data, the SPD’s role in those outcomes remains largely invisible.

Four pillars of data analytics
John Kimsey, VP, Processing Optimization and Customer Success, STERIS, outlined four core areas where data can transform sterile processing performance:
- Resource justification: Quantifying labor, equipment, and instrument inventory needs
- Outcome measurement: Measuring how well SPD is meeting external customer expectations
- Process measurement: Measuring how well SPD processes are predictable and follow standard work
- Efficiency measurement: Measuring how well SPD is performing to operational plan and where performance can be improved
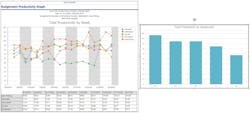
“Understanding how to justify resource needs through data analytics is critical for every SPD leader to understand,” Kimsey explained. “Leveraging a tracking system’s data can provide workload volumes and how long it takes to process products through each step of the workflow. Variations in workloads by time of day, day of week, and season can be evaluated. Productivity by staff, shift, and department can be analyzed and allow the leader to show resource requirements based on facts and data.”
According to Kimsey, the ability to measure performance to expectations is core to managing any operation. He stated, “Whether that’s measuring customer quality, internal process performance, or efficiency, strong leaders want to know how they are doing and where they can improve. Leaders who measure and hold their teams accountable to predictable standard work understand that product quality comes by managing internal process quality.”
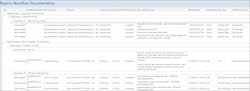
He pointed to the power of guided digital workflows to reinforce compliance and generate actionable metrics, stating, “Tracking systems providing guided workflows help measure staff compliance to standard work, IFUs, and department policies. If you develop an electronic workflow that guides technicians through the steps with electronic confirmation, you can report on that and show the data as proof of compliance.”
Turning data into action
Even departments with tracking systems and dashboards can struggle to interpret what the data means or how to act on it.
“Many tracking systems provide reporting and dashboard capabilities that allow for improved readability and trendsetting,” said Hannah Schroeder, BSHA, CRCST, CIS, CHL, CER, clinical education specialist, Pure Processing. “However, the availability of these data tracking resources necessitates the need for education and training to understand how to use it to its greatest and fullest capabilities.”
As Schroeder points out, consolidating and integrating data points and watching trends and patterns is just the start. “One of the learning curves is understanding how to read, interpret, and then turn data into action items,” she said.
When looking at data points, Schroeder considers how she can get the metrics to tell a comprehensive story when integrated together.
“Sometimes it’s not about adding more but tying together what you have effectively,” she explained. “The concept of pulling the information together isn’t new; software and integrations allow for filtering and consolidating data to answer complex questions and to understand how one may influence the other. It’s becoming increasingly achievable with updates in software capabilities and the integration of AI.”
When asked how SPD teams can turn instrument tracking system data into actionable improvements, Johnson responded:
“The real value lies in using this data to optimize staffing and workflows. Metrics reveal volume patterns and technician output, helping managers align shifts with demand, justify FTE changes, and reduce overtime. Time stamps pinpoint slowdowns, allowing SPDs to redesign layouts, add equipment, or adjust tasks to eliminate delays.
“Dashboards also support broader initiatives, from adding duplicate trays to reduce urgent reprocessing to improving training where errors occur. By turning insights into action—whether reallocating staff, fine-tuning workflows, or investing in resources—SPDs achieve faster turnaround, fewer bottlenecks, and more reliable instrument availability. Ultimately, data-driven decisions enhance efficiency, elevate patient care, and strengthen operational performance.”
Defining productivity and quality in a complex environment
Malone and Gilliam both emphasized the need for standardized definitions that reflect the true scope and complexity of sterile processing work.
“There’s nothing in the industry that defines what SPD productivity should look like,” said Malone. “The Association of periOperative Registered Nurses (AORN) has an OR staffing guideline, 2.5 FTEs per OR. That’s a clear benchmark. SPD doesn’t have that. Should it be based on tray counts? Case complexity? Turnaround times? Until we agree on what to measure, we can’t compare performance fairly or advocate for what we need.”
Gilliam shared that even among OR and SPD leaders, there’s confusion over what productivity means — some use “hours per patient day” or “number of cases,” neither of which accurately reflect the intricacies of sterile processing.
“Departments across the board rely on different metrics, yet none truly capture the complexity of our work,” she stated. “Sterilizing a spine tray involves far more intricacy than processing a tonsil tray, but our productivity measures fail to reflect that distinction. Without a standardized approach, we’re left creating our own definitions of productivity.”
Connecting SPD data to organizational strategy
When SPDs begin collecting standardized data and using it to justify resources, they start to earn recognition as essential partners in operational and financial planning.

“We have to stop thinking of SPD as a support function,” said Jain. “SPD enables surgery. Without sterile processing, there are no instruments — and without instruments, there are no surgeries. It’s like a restaurant with a Michelin-star chef. The surgeon is the chef, but without the right pots, pans, and knives — the instruments — you’re not serving any food. Those tools have become highly complex and expensive, and they deserve respect in their own right.”
He noted that as surgical instruments and procedures become more complex, and hospitals move from global funding to per-case costing models, SPD performance directly affects case-level profitability. “Without visibility into reprocessing costs, hospitals can’t make accurate financial or operational decisions. Once the current state is visible, leaders can remove bottlenecks, standardize steps, and track consistent indicators on a simple dashboard.”
“It’s not theory; it’s a practical way to make SPD performance measurable, predictable, and repeatable,” Jain added. “This level of clarity also supports smarter purchasing and hiring decisions, enables targeted education and training, and allows a true corrective and preventive action (CAPA) program to be developed and implemented that is specific to the needs of that SPD.”
Steps toward a data-driven future
Here are three practical steps in the journey to meaningful SPD data based on insights from the experts:
1. Standardize scan points and definitions
Every facility should define consistent scan points throughout the reprocessing workflow - decontamination, assembly, sterilization, storage, and delivery. These become the backbone for productivity and quality metrics.
2. Integrate data systems
Tracking, scheduling, maintenance, and human resource systems should communicate. Integration allows SPD leaders to correlate tray turnaround times with staffing levels, surgical schedules, and quality outcomes.
3. Invest in data literacy
Whether through education or hiring, SPDs need people who can interpret data and translate it into operational improvements.

“This is where a shift in department requirements could change and may require the addition of a data analyst into your team; specialized individuals who are trained to not only understand the data but see the story through experience, observation, and human connection,” said Schroeder. “Data has the potential to do really great things, but the greater benefit comes when we can connect the data to human impact.”
Kimsey believes that technology can make these goals achievable. “Most SPD departments already have the tools,” he said. “It’s about using them to their fullest. When you map workflows, assign labor standards, and measure cycle time, you create visibility — and visibility leads to improvement.”
From invisible work to visible value
Sterile processing has long been a behind-the-scenes discipline that is essential, but rarely quantified. That’s changing as healthcare becomes increasingly data driven.
With the right data, SPD leaders can demonstrate how process quality drives surgical outcomes, how staffing affects throughput, and how reprocessing efficiency impacts cost and resource utilization.
The data may still be imperfect, but the direction is clear. By defining what to measure and learning how to act on it sterile processing professionals can transform invisible work into visible value.
Key data sources for SPD analytics
Hannah Schroeder, BSHA, CRCST, CIS, CHL, CER, clinical education specialist, Pure Processing, offered these sources of data that SPD leaders can leverage for benchmarking, measurement, and reporting.
Quality management data
- Adverse event reporting
- Customer feedback
- Equipment maintenance & repairs
- Audit results
Staffing
- Rosters
- Schedules
- Competency
- Assignments
Productivity
- Throughput
- Decontamination
- Assembly
- Load records
- Inventory management
- Surgery volumes
6 steps to maximize instrument tracking system data
John Kimsey, VP, Processing Optimization and Customer Success, STERIS, says every SPD leader who has an instrument tracking system should take the following six steps to extract data analytics that can be leveraged to optimize their department.
- Map the instrument processing workflow and ensure you have scanning points for each process step – process steps are action steps such as cleaning, assembling, sterilizing, etc.
- Create standard work for each process step and assign labor standards in the tracking system for staff to “earn” labor time when completing the process – this drives productivity reports.
- Leverage technology-guided workflows to ensure staff compliance to standard work such as following the IFU or department policy.
- Measure how long it takes products and instruments to travel through the process (known as cycle time) and then work to lean out the process to improve or reduce the time.
- Map the inventory staging locations and ensure they are scan points – staging locations are non-action steps where inventory sits such as assembly receipt, out for repair, missing instrument holding, or sterile storage.
- Track how long products sit at each inventory staging location and work to reduce staging or sitting time.”
“No matter what data analytics are used, SPD leaders must make them actionable,” said Kimsey. “We measure to improve, not to report. The best SPD leaders understand the power of data and measurements to identify variance and opportunities. They want to know what’s not working right or performing to plan so they can target areas for improvement. Data should show you where your process is failing, where your team may not be working to plan, or where your next improvement project is needed. Data should be used to reduce and eliminate variance, eliminate root cause quality issues, and improve efficiencies.”
About the Author

Kara Nadeau
Senior Contributing Editor
Kara Nadeau is Sterile Processing Editor for Healthcare Purchasing News.