Screening & Surveillance
By Gorodenkoff on AdobeStock

By ustas on AdobeStock

By Stockwerk-Fotodesign on Adobe Stock

Courtesy of the CDC
Courtesy of UK Health Security Agency (UKHSA)
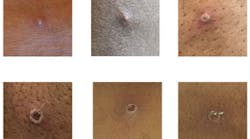
Image by swiftsciencewriting from Pixabay

Photo 211749966 © Markusbeck | Dreamstime.com

Photo by Maxim Hopman on Unsplash
